
Indicators and layers
The Indicators and scripts picker on Pulse - Trade Echo layers, the built-in studies, chart types, compare, events, key levels, alerts and multi-chart layouts.
Everything you add to a Pulse chart comes from one picker, Indicators and scripts. Click Indicators in the toolbar, or + Add in the legend.
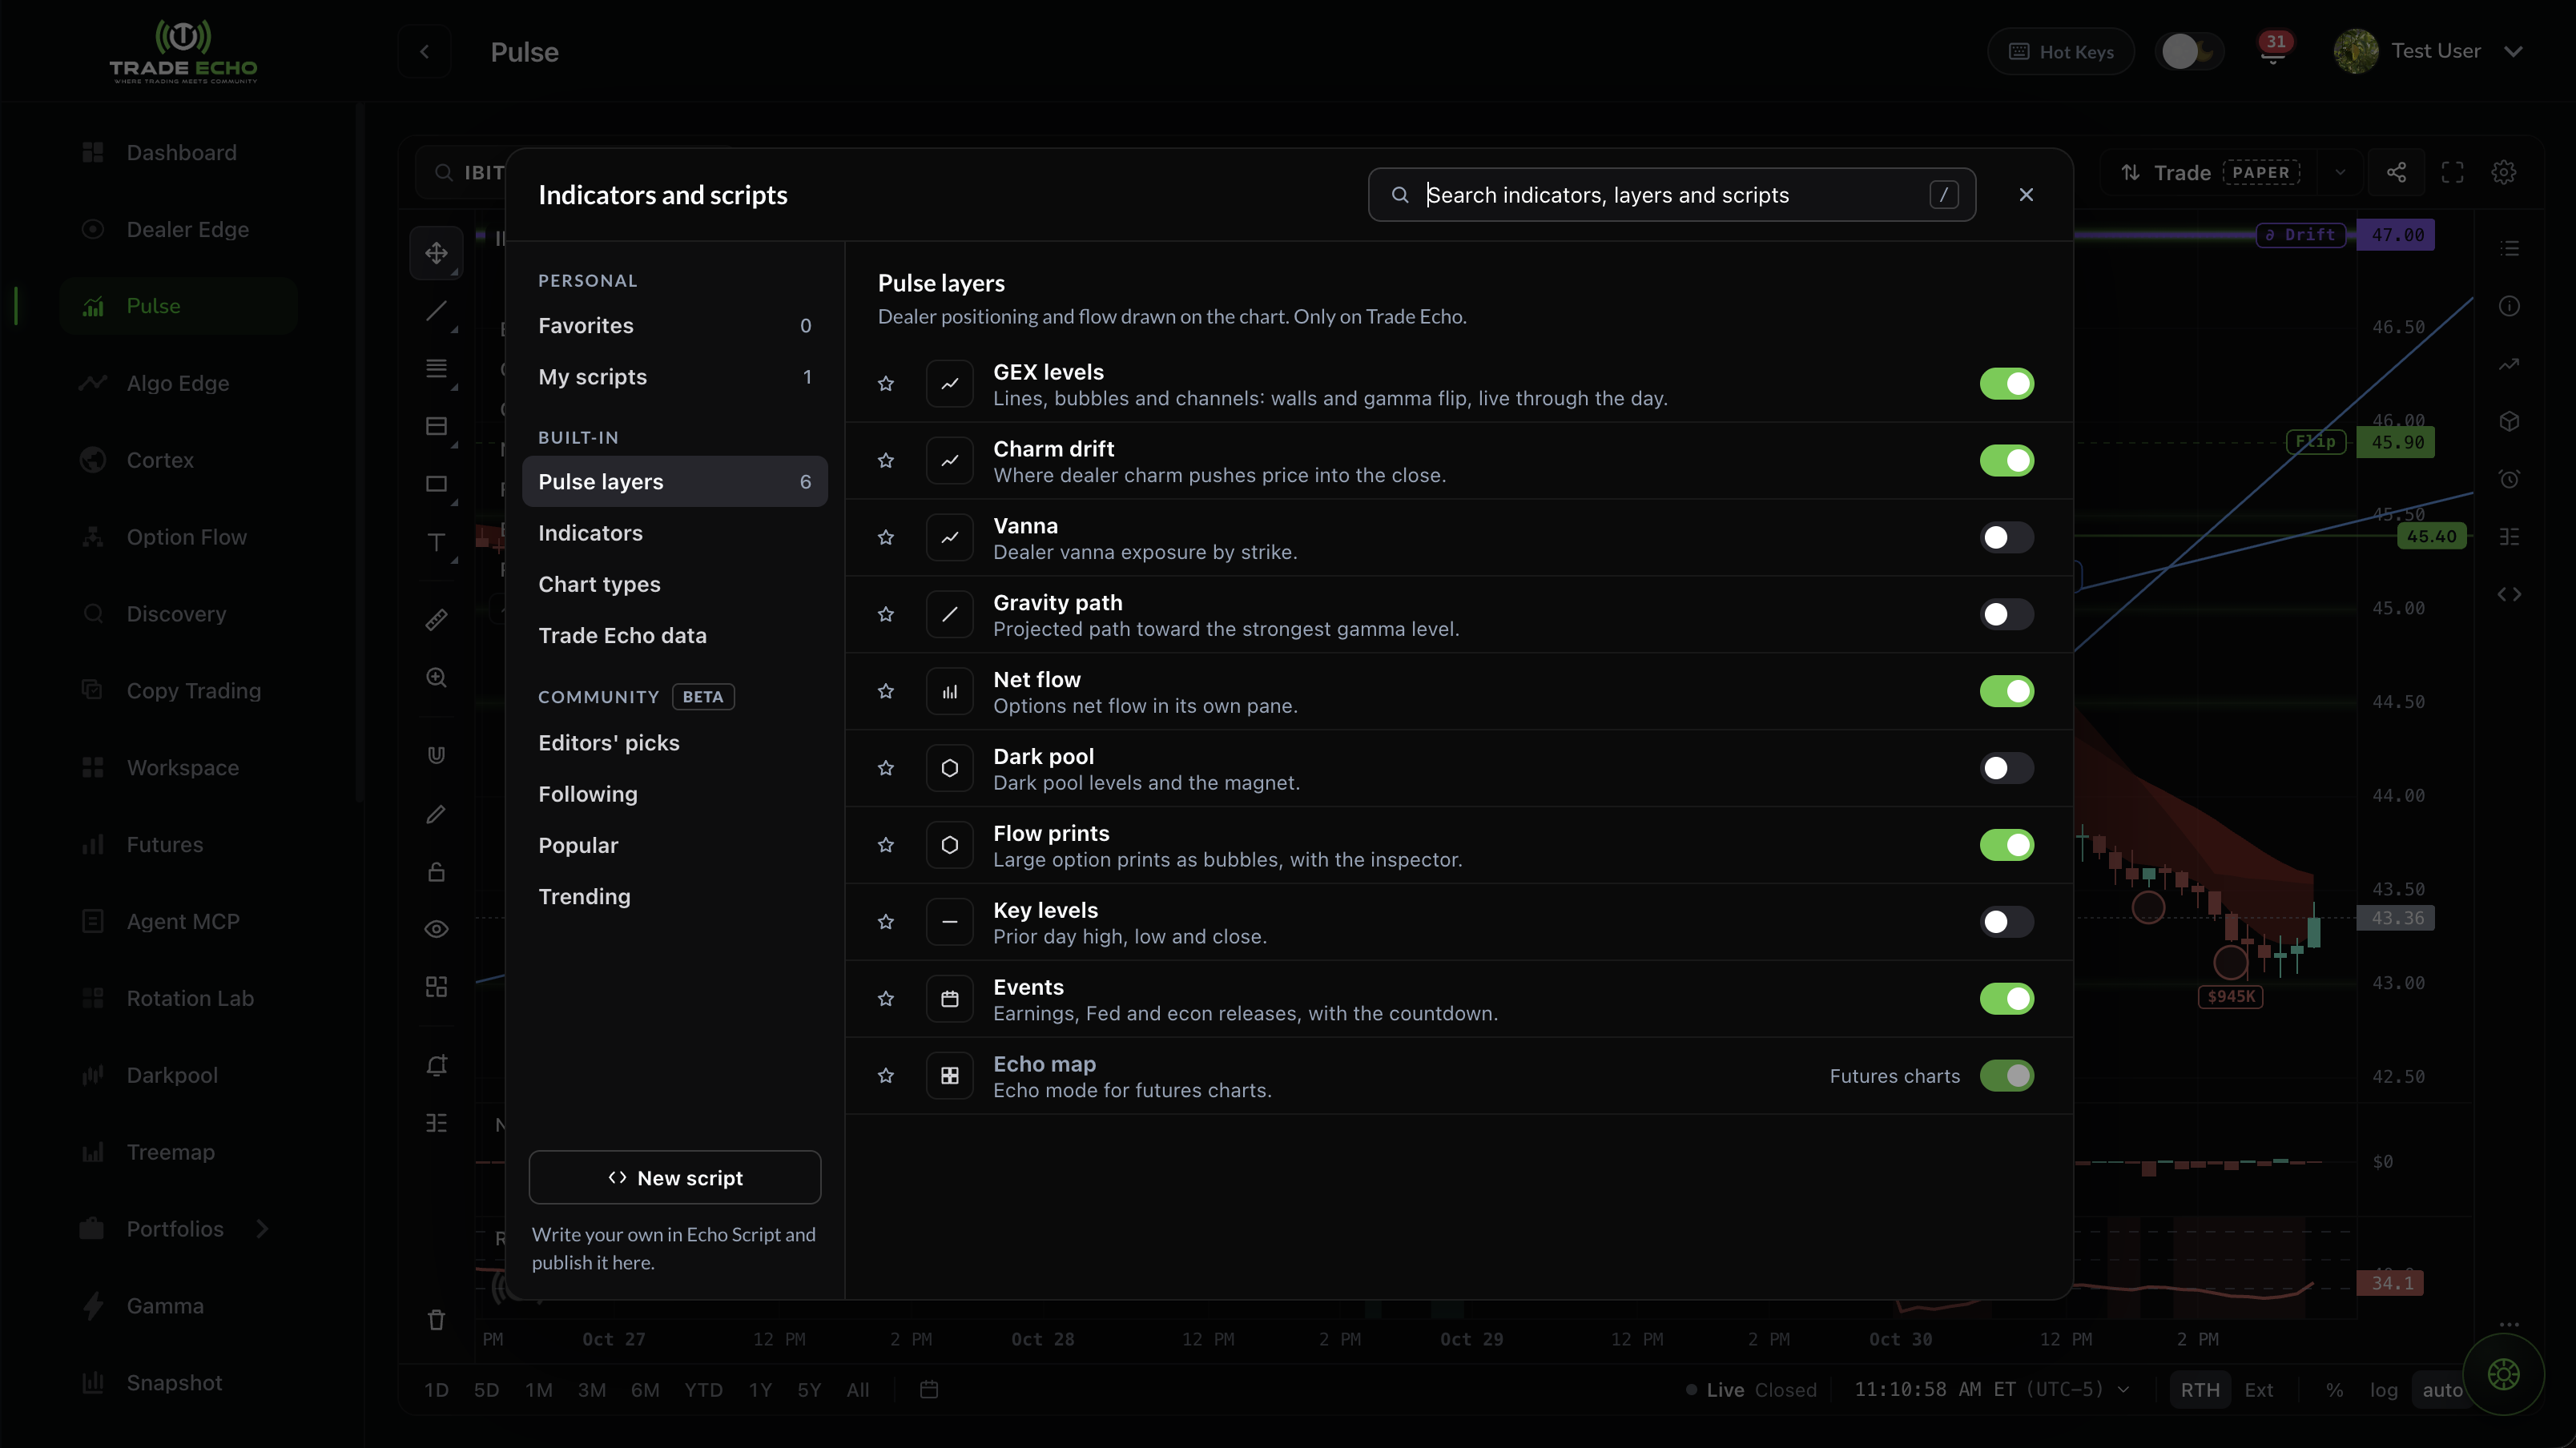 The Indicators and scripts picker on the Pulse layers tab
What's in the picker#
| Tab | What you'll find |
|---|---|
| Favorites | Indicators, layers and scripts you've starred |
| My scripts | Scripts you wrote or copied in Echo Script |
| Pulse layers | Dealer positioning and flow drawn on the chart (below) |
| Indicators | Built-in studies (below) |
| Chart types | How bars draw on this chart |
| Trade Echo data | Scripts built on our GEX, charm, dark pool and flow data |
| Editors' picks | Chosen by the Trade Echo team each week |
| Following | New scripts, versions and comments from authors you follow |
| Popular, Trending | The most-added community scripts, and the ones gaining fastest this week |
The search box at the top searches built-in indicators, Pulse layers, your scripts and the community at once.
The limit: studies and scripts share 5 slots per chart. When the chart is full, turn one off to make room.
Pulse layers#
These draw Trade Echo's own data on price:
| Layer | What it draws |
|---|---|
| GEX levels | Walls and the gamma flip as lines, bubbles or channels, live through the day |
| Charm drift | Where dealer charm pushes price into the close |
| Vanna | Dealer vanna exposure by strike |
| Gravity path | The projected path toward the strongest gamma level |
| Net flow | Options net flow in its own pane |
| Dark pool | Dark pool levels and the magnet |
| Flow prints | Large option prints as bubbles, with an inspector |
| Key levels | Prior day high, low and close, and more (below) |
| Events | Earnings, Fed and econ releases, with a countdown |
| Echo map | Echo mode, on futures charts |
- GEX, Charm, Net flow and Dark pool come from stock options and stock prints, so they don't apply to futures roots.
- For how to read the dealer layers, see Anchor points and defense lines, Charm lens and Gravity Path.
Built-in studies#
Moving averages, VWAP, RSI and BT Cloud, plus these 14 studies:
- Bollinger bands, Keltner channels, Donchian channels, SuperTrend
- Ichimoku cloud, Parabolic SAR, Pivot points (daily)
- Opening range
- MACD, Stochastic, Stochastic RSI, ADX and DMI, ATR, On-balance volume
Opening range draws the high and low of the first 5, 15, 30 or 60 minutes of the session (15 minutes by default). It has options for a midline, a fill, and drawing while the range is still forming. It needs a chart of 1 hour or less.
Each study has its own settings (inputs and style). Open them from the gear on its legend row. See Pulse Quick Start.
Chart types and price scale#
Chart types: Candles, Hollow, Bars, Line, Area, Heikin-Ashi, Baseline and Volume candles.
Price scale: Linear, Log or Percent.
Compare#
Compare puts up to 3 more symbols on the chart as percent change. Turning it on switches the chart to the Percent scale.
Events#
The Events layer marks earnings, Fed meetings and economic releases (CPI, jobs, PPI, PCE and jobless claims) on the chart, with a countdown to the next one.
Key levels#
Prior day high and low, prior close, premarket high and low, and the average daily range (ADR) high and low.
Price alerts and cross alerts#
Price alerts: use Add alert in the toolbar or the Price alerts panel. An alert made on a drawn line moves with the line, and alerts are checked on our servers.
Cross alerts: the bell on a moving average or VWAP alerts you when price crosses that line. They work on 1-minute to 1-hour charts, during regular hours.
The rail#
A strip on the right side of Pulse holds panels: Watchlist, Ticker details, Flow, Plans, Price alerts, the Echo Script editor and More widgets.
Multi-chart#
The Chart layout button shows one, two (side by side or stacked), three, four, six or eight charts at once. Sync switches keep the charts in step:
- Symbol
- Interval
- Crosshair
- Time
- Date range
On narrow screens Pulse shows one chart.
Trade Echo docs are for product education only - not financial advice.